When you price a landscape lighting project, the fixture cost is visible — the installed cost is what determines whether the job makes margin. Most comparison content stops at material prices and ignores what it costs you to put the system in the ground and hand the client a working installation. We manufacture solar landscape fixtures at scale, and we've watched contractors run the numbers on both systems enough times to know where the real cost differences show up: labor hours per fixture, infrastructure scaling limits, and what it takes to source components you can reorder without surprises.
Solar landscape lighting vs low voltage stops being an aesthetic decision when you're bidding 25 fixtures instead of 10, or when the property line is 200 feet from the nearest outlet. The transformer sizing ceiling, wire run voltage drop, and trenching labor add up differently than most project estimates assume. This is a cost structure comparison for contractors who need to know what each system actually costs to install, maintain, and source at volume.
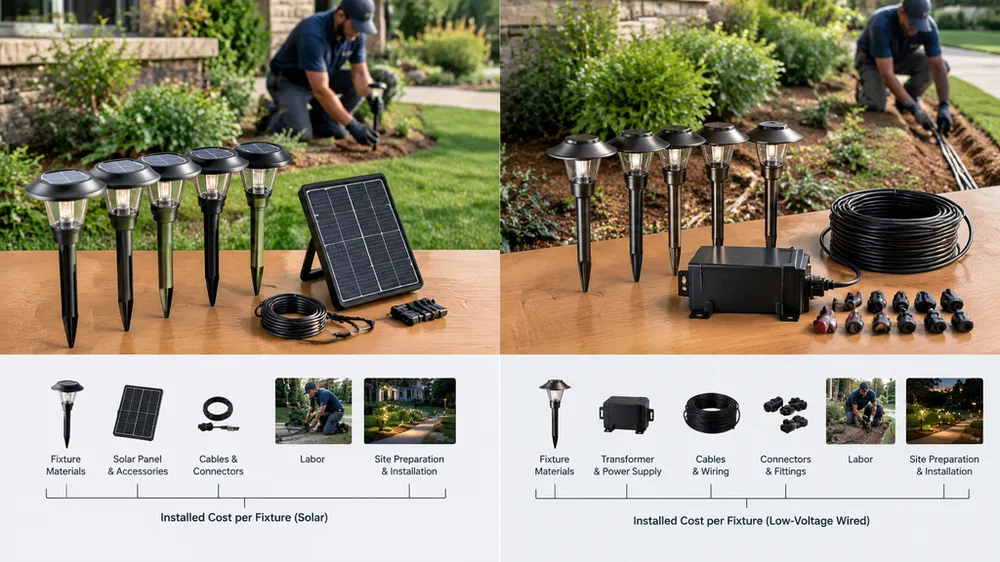
Installed Cost per Fixture — Materials and Labor Breakdown
The fixture price is only the starting line. Installed cost includes the fixture, infrastructure components, trenching or mounting hardware, and labor hours to get the system working. For solar landscape lighting vs low voltage comparisons, the infrastructure gap is where most project estimates break.
Solar installed cost per fixture: $45–75
- Fixture: $35–55 (IP65/IP67-rated solar pathway or garden light, 80–120 lumen output, LiFePO4 battery, 2–4W solar panel)
- Labor: 15 minutes per fixture at $40/hour contractor rate = $10 per fixture
- No transformer, no wire, no trenching
Low-voltage installed cost per fixture: $65–110
- Fixture: $25–40 (12V LED pathway light, 50–100 lumen output, separate transformer required)
- Transformer allocation: $8–15 per fixture (200–300W transformer supporting 15–20 fixtures, prorated across install count)
- Wire: $3–8 per fixture (12/2 or 14/2 landscape wire, 50–100 feet average run per zone)
- Trenching: $12–25 per fixture (4–6 inches deep, labor and backfill, varies with soil conditions)
- Labor: 45 minutes per fixture at $40/hour = $30 per fixture
The material cost advantage of wired fixtures disappears when you add the infrastructure. A $30 low-voltage fixture costs $65–110 installed because you're also buying and installing the transformer, wire runs, and trenching labor. A $45 solar fixture costs $55–75 installed because the labor is placement and activation — no wiring, no transformer mounting, no voltage testing.
Labor rate assumptions matter here. We're using $40/hour as a mid-range contractor rate for landscape installation work. If your crew rate runs $50–60/hour, the labor delta between solar and low-voltage installs widens further. The 15-minute solar placement vs 45-minute wired fixture install is consistent across crew rates — the ratio holds whether you're billing $35 or $65 per labor hour.
One detail most cost comparisons miss: low-voltage installs require electrical testing at each fixture. You're confirming voltage at the lamp head (should see 10.8–12V on a 12V system after accounting for wire run drop), checking connections, and troubleshooting dim fixtures caused by undersized wire or overloaded transformers. Solar installs skip that entire testing cycle. You stake the fixture, turn it on, confirm the LED activates at dusk, and move to the next placement.
Transformer Sizing and Wire Run Economics — The Hidden Scalability Ceiling
Low-voltage landscape lighting systems hit a hard infrastructure ceiling that doesn't show up in per-fixture material costs. The transformer capacity and wire gauge determine how many fixtures you can run on a single zone, and every time you exceed that capacity you're adding another transformer, home run, and wire routing path. Solar landscape lights no wiring infrastructure means every fixture you add scales independently.
Residential and light commercial low-voltage transformers typically handle 200–300W total load. A 100-lumen 12V LED landscape fixture draws 8–10W, so a 300W transformer supports 20–25 fixtures at maximum capacity. That sounds straightforward until you account for wire run voltage drop. 12-gauge landscape wire loses approximately 2V per 100 feet at 10A load. If you're running fixtures 150 feet from the transformer, you're seeing 9–10V at the fixture end instead of the 12V you started with. Fixtures dim, clients complain, and you're either upsizing the wire to 10-gauge or splitting the zone into two shorter runs with separate transformers.
The voltage drop constraint creates a practical distance ceiling of 100–150 feet per transformer zone for consistent brightness. Properties with lighting needs beyond that perimeter require multiple transformers, each needing its own power source, mounting location, and wire home runs. Adding 10 more fixtures to an existing low-voltage install isn't a matter of buying 10 more fixtures — it's recalculating transformer load, checking voltage drop across the extended wire run, and often installing a second transformer to keep the system performing correctly.
Solar systems scale by adding fixtures. No transformer capacity to track, no voltage drop to calculate, no wire run limits. A 10-fixture solar install and a 50-fixture solar install use the same infrastructure model: place fixture, confirm solar panel exposure, turn on. When a client asks you to add 8 more pathway lights after the initial install, you're not redesigning zones or upsizing transformers. You're placing 8 more fixtures and billing for 8 fixtures worth of labor.
This scalability difference compounds on larger properties. A 50-fixture low-voltage install on a property with 200+ feet of perimeter lighting requires 2–3 transformers, each with its own power tap and wire routing. The transformer count alone adds $400–900 in equipment cost before you account for the additional labor to mount, wire, and test multiple zones. The same 50-fixture layout in solar landscape lighting vs low voltage terms requires 50 fixtures and zero infrastructure upsizing.
Scope creep is where low voltage landscape lighting vs solar cost differences become visible to contractors who've run both systems. Clients regularly ask to add fixtures after initial install — 3 more garden accent lights, 5 more pathway fixtures along a newly landscaped bed, 2 flood lights near an outbuilding. With solar, that request is a fixture order and a 2-hour placement visit. With low-voltage, you're checking transformer capacity, calculating wire run extensions, and often explaining why adding 5 fixtures requires a second transformer and why that costs more than 5 times the per-fixture install price.
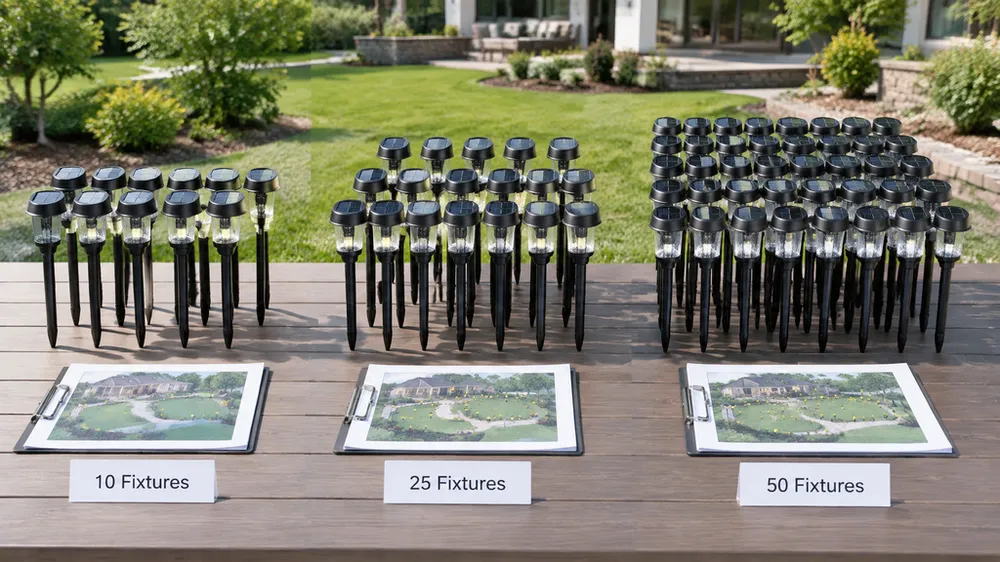
Project Scale Economics — 10, 25, and 50 Fixture Comparisons
Project cost scales differently for solar vs low voltage landscape lighting cost structures. Small residential projects see a modest installed cost difference; larger properties see the infrastructure costs of low-voltage systems compound as transformer and wire run counts multiply.
10-fixture residential project:
- Solar total installed cost: $450–750 (10 fixtures × $45–75 per fixture installed)
- Low-voltage total installed cost: $650–1,100 (10 fixtures × $25–40 fixture cost + $150–200 transformer + $30–80 wire + $120–250 trenching + $300 labor)
- Labor hours: 2.5 hours solar (10 fixtures × 15 min) vs 7.5 hours low-voltage (10 fixtures × 45 min)
- Cost difference: $200–350 lower for solar on typical residential installs
25-fixture commercial property:
- Solar total installed cost: $1,125–1,875 (25 fixtures × $45–75)
- Low-voltage total installed cost: $1,950–3,250 (25 fixtures requiring 2 transformers, extended wire runs, multiple zones)
- Labor hours: 6.25 hours solar vs 18.75 hours low-voltage
- Cost difference: $825–1,375 lower for solar at this scale
The 25-fixture threshold is where low-voltage systems start requiring multiple transformers and zone planning. A single 300W transformer can technically support 25 low-wattage fixtures, but voltage drop over extended runs forces most installs into 2-zone designs with 2 transformers to maintain consistent brightness. That doubles the transformer equipment cost and adds routing complexity that increases labor hours beyond simple per-fixture multiples.
50-fixture large installation:
- Solar total installed cost: $2,250–3,750 (50 fixtures × $45–75)
- Low-voltage total installed cost: $4,500–7,500 (50 fixtures requiring 3 transformers, extensive wire routing, multiple trenching runs)
- Labor hours: 12.5 hours solar vs 37.5 hours low-voltage
- Cost difference: $2,250–3,750 lower for solar at large project scale

The cost curves diverge because solar scales linearly — double the fixture count, double the cost — while low-voltage scales in infrastructure steps. Every time you exceed transformer capacity or voltage drop tolerances, you're adding another full infrastructure layer (transformer, power tap, wire home runs) on top of the per-fixture material cost.
Project margin implications run both directions. If you're competing on price, the lower installed cost of solar lets you bid more aggressively and still hit target margin. If your client is working with a fixed budget, the same dollar amount buys more coverage and fixture count in solar than low-voltage, so you can propose a more complete lighting solution within their number. Both paths lead to the same conclusion: lower installation labor means more project margin or more competitive bids, and you control which lever you pull.
One contractor we supply runs both systems depending on project requirements. His pricing model allocates 40% of bid price to labor and 35% to materials, leaving 25% target margin. On 25-fixture projects, his solar bids come in 22–30% lower than low-voltage equivalents at the same margin, or he can match low-voltage bid prices and run 30–35% margin on solar installs. He uses that margin flexibility to win commercial property contracts where the decision comes down to total project cost rather than fixture aesthetics.
Installation Labor Hour Delta — What Drives the Cost Difference
The installed cost difference between solar landscape lighting vs low voltage systems comes down to what you physically do to get a fixture working. Solar installs eliminate three labor-intensive steps that low-voltage systems require: trenching, wire routing, and electrical connection testing.
Solar installation steps per fixture:
- Mark fixture placement based on lighting plan (2 minutes)
- Drive ground stake or mount fixture to hardscape (5 minutes)
- Position solar panel for southern exposure and confirm no tree canopy shading (3 minutes)
- Activate fixture by removing battery tab or switching to ON position (2 minutes)
- Confirm LED illumination at dusk or with panel coverage test (3 minutes)
Total per fixture: 15 minutes. One crew member can place and activate 20–24 solar fixtures in a standard 6-hour workday after accounting for site setup, equipment staging, and placement adjustments.
Low-voltage installation steps per fixture:
- Mark fixture placement and wire routing path (3 minutes)
- Trench 4–6 inches deep along routing path, or surface-route wire through landscape beds (15–20 minutes per fixture depending on soil conditions and landscape obstacles)
- Run 12/2 or 14/2 landscape wire from transformer to fixture locations (5 minutes)
- Strip wire ends and connect to fixture terminals using wire nuts or compression connectors (4 minutes)
- Mount fixture to stake or hardscape (5 minutes)
- Test voltage at fixture with multimeter to confirm 10.8–12V after wire run drop (3 minutes)
- Backfill trenches and restore landscape surface (5–8 minutes)
Total per fixture: 45–60 minutes. One crew member installs 6–8 low-voltage fixtures per day, with higher output possible on properties with easy trenching conditions and short wire runs.
The 3:1 labor ratio is the driver behind landscape lighting installation cost comparison outcomes. Three times the labor hours means three times the labor cost, which typically represents 35–45% of total installed project cost. That labor multiplier compounds across fixture count — a 25-fixture project that takes 6 hours with solar takes 18–20 hours with low-voltage, turning a one-day install into a multi-day job.
Solar installs also reduce crew skill requirements. Any landscaping crew member can place and activate solar fixtures — no electrical knowledge needed, no voltage testing, no transformer wiring. Low-voltage installs require at least one crew member who understands transformer load calculations, voltage drop limits, and electrical troubleshooting when fixtures don't illuminate correctly. That skill premium often translates to higher crew rates or limits which team members can handle the lighting portion of a project.
Callback and troubleshooting labor tells the same story. A solar fixture that stops working gets diagnosed in 5 minutes (battery failure or solar panel damage) and swapped out in another 5 minutes. You're not tracing wire runs, testing connections, or diagnosing voltage drop issues. A low-voltage fixture that goes dark requires wire continuity testing, voltage measurement at multiple points along the home run, connection inspection at wire nuts, and transformer load verification — often 30–45 minutes of diagnostic time before you even identify the failure point.
We've supplied fixtures to contractors who switched from low-voltage to solar specifically to reduce labor cost per project. One landscaping company in Arizona calculated that their average crew rate was $45/hour fully loaded (wages, benefits, vehicle, equipment). The 30-minute labor savings per fixture on solar installs meant every 10-fixture project saved $225 in labor cost, which let them either underbid low-voltage competitors by $200–300 or pocket the difference as additional margin. At 40 lighting projects per year, that labor efficiency translated to $9,000–12,000 in annual margin improvement or competitive advantage.
Battery Autonomy and Reliability — Addressing Contractor Concerns About Solar Performance
The most common objection we hear from contractors evaluating solar landscape lighting vs low voltage systems: "My client will call me back in six months when the solar fixtures stop working." That concern is legitimate if you're sourcing consumer-grade solar from big-box retailers or Amazon. It doesn't apply to commercial-grade solar fixtures with factory-validated battery and charge controller specifications.
Battery cycle life in commercial solar landscape fixtures: 1,200–1,500 charge/discharge cycles for LiFePO4 (lithium iron phosphate) batteries. One cycle = one night of discharge and one day of recharge. At 365 cycles per year, that's 3.3–4.1 years of nightly operation before battery capacity degrades below 80% of original performance. Most contractors replace landscape lighting fixtures on 5–7 year cycles anyway as clients update landscape designs, so solar battery lifespan aligns with typical fixture replacement timelines.
The battery chemistry matters more than most product specs acknowledge. Lithium-ion batteries (Li-ion) degrade faster in temperature extremes and offer 500–800 cycles in landscape applications. LiFePO4 batteries tolerate temperature swings better, maintain capacity through more cycles, and cost $2–4 more per fixture at factory volume. We spec LiFePO4 across our landscape fixture line because the callback rate difference justifies the battery cost premium. A contractor who installs 200 solar fixtures per year and sees 8% callback rate with Li-ion batteries vs 2% callback rate with LiFePO4 batteries is looking at 12 fewer service calls annually — that's $600–900 in avoided callback labor at typical service rates.
Charge autonomy addresses the "what happens in winter" question. Solar landscape fixtures need enough battery capacity to run through a full night even when daily sunlight charging is reduced during short winter days or extended cloudy periods. Properly sized systems use 3.2V 3,000–5,000 mAh battery packs paired with 2–4W solar panels. That combination delivers 8–10 hours of runtime in summer and 6–8 hours in winter, assuming the fixture draws 0.8–1.2W during operation (typical for 80–120 lumen LED output).
The charge autonomy calculation that matters to contractors: how many consecutive cloudy days before the fixture stops illuminating at night. A 5,000 mAh battery paired with a 4W solar panel provides approximately 3 days of autonomy after accounting for charge controller efficiency losses and battery discharge safety margins. Most climate zones see at least partial sunlight every 2–3 days even during prolonged cloudy periods, so the battery recovers enough charge to maintain nightly operation. The fixtures that fail this test are undersized systems with 1,200–2,000 mAh batteries and 1–2W panels — common in sub-$20 consumer-grade solar lights, rare in commercial-grade fixtures designed for landscape contractor use.
IP65 and IP67 ratings determine whether fixtures survive landscape irrigation, seasonal rain, and ground-level water pooling. IP65 means dust-tight and protected against water jets from any direction — adequate for raised landscape fixtures and pathway lights above grade. IP67 means dust-tight and protected against temporary submersion up to 1 meter depth for 30 minutes — necessary for in-ground fixtures and installations in flood-prone areas or near irrigation spray zones.
We test IP ratings at the enclosure level, not just the fixture housing. The solar panel junction, battery compartment, LED driver, and wire entry points all get sealed and tested independently before final assembly. The IP rating only holds if every potential water entry path is sealed to spec. That's why we see fixtures from some suppliers fail IP claims after one season — they test the main housing but leave the solar panel back or battery door unsealed. Our QC process submersion-tests assembled fixtures for 45 minutes at 1.2 meter depth and rejects any unit that shows moisture intrusion or voltage drop after the soak test.
Factory QC protocols separate commercial-grade solar from consumer-grade failures. Every production batch goes through battery matching (grouping cells with <3% capacity variance), charge/discharge cycle testing (confirming rated cycles under accelerated test conditions), lumen output verification (integrating sphere measurement at 3000K–6000K color temperatures), and IP rating spot checks (random sample submersion testing per batch). We maintain test records for every production lot and can trace any fixture back to its battery supplier batch, LED bin, and QC test results. When a contractor reports an early failure, we pull the lot data and determine whether it's a component defect, a specification mismatch, or an installation condition the fixture wasn't rated for (usually direct burial without IP67 rating, or installation under dense tree canopy that never receives direct sunlight).
The reliability gap between factory-direct commercial solar and consumer-grade solar is the difference between 2–4% annual callback rates and 15–25% callback rates. Contractors who tested solar using big-box consumer fixtures and saw high failure rates often assume all solar performs the same way. Commercial-grade fixtures with validated battery specs, IP67 sealing, and factory QC reduce failures to levels comparable with low-voltage systems — both technologies see occasional LED driver failures, wire connection corrosion, or physical damage from landscape equipment, but neither should generate frequent callbacks if components are specified correctly for the application.
Grid Access and Site Constraints — When Each System Makes More Sense
Solar vs low voltage landscape lighting cost economics shift based on site conditions. Some properties favor low-voltage because power access and short fixture runs minimize installation complexity; others favor solar because distance from power or difficult trenching terrain turn low-voltage infrastructure costs prohibitive.
Low-voltage makes more sense when:
- All fixture locations are within 100 feet of an accessible outdoor power source
- Client prioritizes absolutely consistent brightness year-round regardless of weather or battery performance
- Soil conditions are ideal for trenching (sandy loam, minimal rock, no irrigation lines or underground utilities to avoid)
- Project is <10 fixtures concentrated in a small area where one transformer and one wire home run covers the full layout
- Historical property or architectural restrictions prevent stake-mounted fixtures but allow surface-wired discrete wire routing
Low-voltage delivers the most consistent lumen output because it's grid-powered. Solar brightness is consistent within battery charge capacity, but extended cloudy periods can reduce runtime or brightness. For clients who view landscape lighting as essential security infrastructure rather than aesthetic enhancement, that grid reliability matters more than installation cost differences.
Solar makes more sense when:
- Any fixture locations are >150 feet from power (voltage drop and wire cost make low-voltage uneconomical at distance)
- No convenient outdoor power outlets exist near lighting zones (adding outlets requires electrical permit and licensed electrician, often $400–800 per outlet)
- Site has rocky soil, heavy clay, or extensive underground irrigation that increases trenching difficulty and cost
- Property lines or fixture layouts require lighting across multiple zones separated by 200+ feet (multiple transformers and home runs add cost that exceeds solar fixture premium)
- Client prioritizes low maintenance and wants to avoid transformer failures or wire degradation callbacks
- Installation timeline is constrained (solar installs complete in 1/3 the time vs low-voltage)
The distance-from-power threshold is where solar landscape lights no wiring advantage becomes decisive. Once you're running wire 150+ feet from the transformer, you're either accepting significant voltage drop (and dimmer fixtures at the end of the run) or upsizing to 10-gauge wire at $0.60–0.90 per linear foot. A 200-foot wire run in 10-gauge adds $120–180 in wire cost alone, before trenching labor. At that distance, the wire and trenching cost exceeds the fixture cost premium between low-voltage and solar.
Hybrid approach works when:
- High-visibility entry lighting and architectural accent lights near the building use low-voltage for maximum reliability and brightness control
- Pathway lighting, perimeter security lighting, and outlying garden zones use solar to avoid long wire runs and reduce installation labor
- Client wants the option to add fixtures in remote zones without electrical work
We've seen commercial properties use hybrid layouts where building-mounted wall packs and entry area lighting run on low-voltage connected to building power, while parking lot perimeter lights and pathway fixtures use solar. That approach puts grid power where consistency matters most (client-facing entry areas) and uses solar where coverage and installation speed matter more than absolute brightness consistency (parking lot safety lighting, employee pathway lighting).
One decision pattern we see from contractors who've run both systems: they spec solar for initial project bids to minimize installed cost and win the contract, then offer low-voltage as an upgrade option for clients who raise reliability concerns after reviewing the proposal. The solar-first bidding strategy puts their number 20–30% lower than low-voltage competitors, and clients who want wired systems can upgrade for the cost difference. Clients who accept the solar proposal deliver higher project margin; clients who upgrade to low-voltage still give the contractor the project win, just at lower margin.
Maintenance Cost and Callback Risk Over 3-Year Project Lifespan
Installed cost determines project margin; maintenance cost determines long-term client relationship viability. Solar landscape lighting vs low voltage maintenance profiles differ in failure modes, callback frequency, and service labor per incident.
Low-voltage maintenance and failure modes:
Transformer failures occur in 2–4% of installed transformers annually, typically caused by moisture intrusion in outdoor-rated enclosures or internal component failure in photo sensor circuits. Replacement cost: $120–250 for residential-grade 200–300W transformers including labor to disconnect, swap, and restore connections. Transformer failures are rare but expensive per incident because they take down entire lighting zones until replaced.
Wire degradation from physical damage is the most common low-voltage callback. Landscape maintenance equipment (aerators, edgers, rototillers) cuts buried wire, rodents chew through insulation, and freeze-thaw cycles crack wire jackets in northern climates. Diagnosing wire breaks requires tracing the full home run with a continuity tester, locating the break point, splicing in repair sections, and re-burying the repair. Service time: 1.5–3 hours depending on wire run length and accessibility. Frequency: 5–8% of installed systems per year in high-maintenance landscape environments.
Voltage drop diagnosis becomes necessary when fixtures at the end of wire runs start dimming while fixtures near the transformer remain bright. The cause is usually undersized wire for the load and distance, or additional fixtures added to an existing zone that exceed transformer capacity. Fixing voltage drop requires either upsizing wire gauge (expensive and labor-intensive because you're re-trenching the full run) or adding a second transformer to split the load (adds equipment cost and requires new power tap). Contractors often absorb this cost during warranty periods rather than billing clients for a design miscalculation.
Connection corrosion at wire nuts and fixture terminals occurs in 3–5% of fixtures annually in humid climates or installations exposed to irrigation spray. Corroded connections increase resistance, causing fixtures to dim or flicker. Repair requires re-stripping wire ends, cleaning terminals, and re-making connections with fresh wire nuts and dielectric grease. Service time: 20–30 minutes per fixture after diagnosis.
Solar maintenance and failure modes:
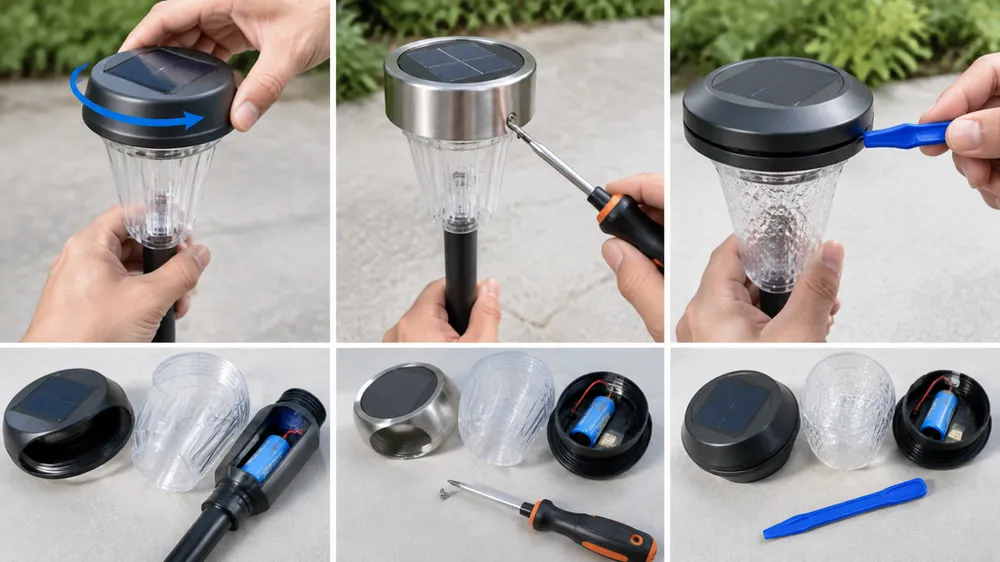
Battery replacement at 3–4 year mark is the primary planned maintenance event for solar fixtures. Battery capacity degrades below 80% of original performance after 1,200–1,500 cycles, reducing runtime from 8–10 hours to 5–6 hours. Clients notice when fixtures start going dark before dawn. Replacement cost: $8–15 per fixture for LiFePO4 battery packs including labor to open battery compartment, disconnect old pack, install new pack, and test operation. Most contractors batch battery replacements across multiple fixtures during a single service visit to reduce per-fixture labor cost.
Solar panel cleaning is necessary in dusty climates or installations under trees that drop sap or pollen. Dirty panels reduce charge efficiency, extending charge times and reducing battery autonomy. Cleaning frequency: annually in dusty environments (desert climates, properties near unpaved roads), every 2–3 years in typical suburban landscapes. Service time: 10 minutes per fixture with spray bottle and microfiber cloth. Some contractors include annual cleaning in maintenance contracts; others skip it unless clients report reduced runtime.
LED module replacement becomes necessary at 5+ years in high-quality fixtures (typical LED lifespan is 25,000–50,000 hours; 8 hours per night = 2,920 hours per year). LED failures present as reduced brightness, color shift, or complete illumination loss. Replacement cost: $12–20 per fixture for LED driver and emitter assembly. Less common than battery replacement because LEDs typically outlast the battery cycle life.
Early battery failures in the first 6–12 months indicate manufacturing defects or installation conditions that prevent adequate solar charging (dense tree canopy shading, north-facing panel orientation, panel covered by landscaping growth). Callback frequency: 2–4% of installed fixtures in commercial-grade solar, 15–25% in consumer-grade solar. Service response: fixture swap under warranty, or battery pack replacement if outside warranty period.
Total cost of ownership over 3 years:
Low-voltage maintenance cost per fixture over 3 years: $8–18
- Transformer failures: $6–12 per fixture (prorated across fixtures served by that transformer, 2–4% annual failure rate)
- Wire repair callbacks: $2–4 per fixture (5–8% annual callback rate, averaged across installed base)
- Connection corrosion: $0–2 per fixture (regional variation based on climate)
Solar maintenance cost per fixture over 3 years: $0–12
- Battery replacement at end of 3-year period: $8–15 per fixture (proactive replacement, not callback)
- Early battery failures: $0–2 per fixture (2–4% failure rate, warranty replacement in most cases)
- Panel cleaning: $0–2 per fixture (10 min labor, only in dusty climates)
Callback probability matters as much as per-incident cost. Low-voltage systems generate 5–8% annual callbacks for wire damage, connection issues, or transformer failures. Solar systems generate 2–4% annual callbacks for early battery failures or installation condition problems. Lower callback frequency means less service labor, fewer client complaints, and less margin erosion from warranty service work.
Warranty support structure differs between systems. Low-voltage component warranties are fragmented: fixture manufacturers warrant fixtures (typically 2–3 years), transformer manufacturers warrant transformers (1–3 years), and wire has no meaningful warranty. When a low-voltage system fails, diagnosing which component failed determines who covers replacement cost. Factory-direct solar suppliers typically warrant the complete fixture including battery, solar panel, LED module, and housing for 3 years. Single-source warranty eliminates finger-pointing between component suppliers when failures occur.
One maintenance advantage low-voltage systems hold: grid power means no performance degradation over time. Solar fixtures maintain consistent brightness as long as batteries hold charge, but battery capacity gradually declines until replacement. Low-voltage fixtures deliver the same lumen output in year 5 as year 1 (assuming LED lifespan isn't exceeded). For applications where brightness consistency is critical, that grid-powered reliability justifies the higher maintenance callback frequency.
Bulk Sourcing Economics — Factory-Direct Solar vs Wired Component Procurement
Project cost comparisons typically assume you're buying fixtures one project at a time. Contractors who run multiple lighting projects annually can reduce per-fixture cost significantly through bulk purchasing — but the sourcing model differs completely between solar vs low voltage landscape lighting cost structures.
Low-voltage per-project sourcing:
Most contractors source low-voltage components from three separate suppliers: fixtures from landscape lighting distributors, transformers and wire from electrical supply houses, and installation hardware from landscape supply or big-box stores. Each supplier relationship operates on separate payment terms, ships on different timelines, and requires individual purchase orders per project.
Typical procurement cycle for a 25-fixture low-voltage project:
- Fixtures: order from landscape distributor, 3–7 day lead time, net-30 terms after credit approval
- Transformers: order from electrical supply, 2–5 day lead time, net-30 terms
- Wire: purchase from electrical supply or big-box, same-day availability but requires store visit
- Installation hardware (stakes, connectors, wire nuts): landscape supply or hardware store, same-day
Total procurement lead time: 7–10 days from order to all components on site. Contractors either carry component inventory (ties up working capital) or wait for parts to arrive before starting installs (extends project timelines).
Per-project pricing on low-voltage components:
- Fixtures: $25–40 per unit (typical pathway light, no volume discount below 50-unit orders)
- Transformers: $150–250 per unit (300W residential grade)
- Wire: $0.35–0.60 per linear foot (12-gauge landscape wire, 500-foot roll purchases)
Solar factory-direct pricing and sourcing:
Factory-direct solar purchasing consolidates fixture, battery, solar panel, and LED module into one per-unit price from one supplier. Volume pricing tiers reduce per-fixture cost as order quantity increases, and contractors can stock inventory without managing multiple component SKUs.
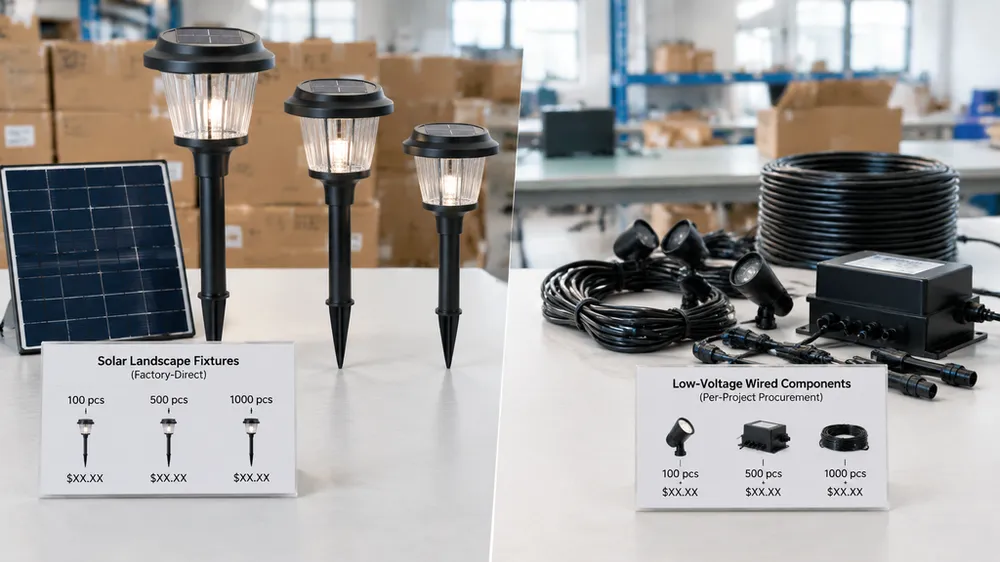
JXSOL factory-direct pricing tiers (landed cost, freight included):
- 100-unit MOQ: $38–45 per fixture (commercial-grade IP67 pathway/garden lights, 80–120 lumen output, LiFePO4 battery)
- 500-unit order: $32–38 per fixture
- 1,000-unit order: $28–35 per fixture
Freight cost is included in landed pricing using FOB destination terms (we cover ocean freight and customs clearance to your receiving warehouse or dock). Lead time from PO approval to delivery: 25–35 days for first orders (includes production queue and ocean transit), 15–20 days for repeat orders from established customers (we maintain 500–1,000 unit safety stock of standard SKUs for quick-turn reorders).
The 100-unit MOQ is calibrated for landscaping contractors who run 10–15 lighting projects per year at 8–12 fixtures per project. That order volume represents 8–10 months of inventory for a typical contractor, which ties up less working capital than carrying low-voltage components for the same project count (100 solar fixtures at $38 = $3,800 inventory value vs 100 low-voltage fixtures + transformers + wire + hardware = $4,200–5,500 depending on project configurations).
Contractors who run 40+ lighting projects annually hit the 500-unit pricing tier, which reduces per-fixture cost to $32–38. At that volume, the solar fixture cost approaches the per-fixture installed cost of low-voltage systems ($32 solar fixture + $10 install labor = $42 installed vs $65–110 installed for low-voltage). The margin difference at volume becomes large enough that some contractors switch to solar-only offerings to maximize margin rather than offering both systems.
OEM customization at volume:
Standard catalog fixtures ship with preset specifications (lumen output, color temperature, housing finish). Orders of 500+ units qualify for OEM specification customization without tooling charges:
- Lumen output: 80, 100, 120, or 150 lumen options (changes LED bin and driver current)
- Color temperature: 3000K warm white, 4000K neutral, 5000K daylight, 6000K cool white
- Housing finish: matte black, bronze, graphite, or brushed nickel (powder coat color change)
- Battery capacity: 3000, 4000, or 5000 mAh (affects runtime and charge autonomy)
Contractors who build repeat business with property management companies or HOA developments use OEM customization to maintain brand consistency across properties. One contractor we supply services 12 commercial office parks and specs all landscape lighting at 4000K neutral white with graphite housing. His 600-unit annual volume qualifies for custom specs, and the consistent appearance across properties reinforces his brand with property managers who control multiple site contracts.
Payment terms and credit:
First-time orders: 30% deposit on PO approval, 70% balance due before shipment (wire transfer or letter of credit).
Established customers (after 2–3 on-time payments): Net-30 terms available, subject to credit review. Some high-volume contractors negotiate net-60 terms once annual volume exceeds 1,000 units.
The deposit requirement on first orders is standard for factory-direct importing. Most landscape contractors are structured as small LLCs or S-corps without extensive credit history, so Chinese factories require deposit protection until payment reliability is established. After the first 2–3 orders ship and payments clear on time, the relationship shifts to trade credit terms that match domestic supplier arrangements.
Inventory stocking vs per-project ordering:
Contractors who stock solar inventory eliminate procurement lead time from project timelines. When a client approves a lighting proposal, fixtures are already on hand and installation can start within days rather than waiting 1–2 weeks for component delivery. That timeline advantage helps close commercial contracts where clients want lighting operational before seasonal events or business openings.
The working capital cost of stocking 100 solar fixtures ($3,800 at MOQ pricing) is comparable to the accounts receivable float on 3–4 completed lighting projects at typical payment terms (net-30 from commercial clients). Most contractors find the inventory cost acceptable once they're running consistent lighting project volume, because the speed-to-install advantage helps win time-sensitive commercial contracts that offset the inventory carrying cost.
MOQ flexibility at 100 units is deliberate positioning for contractor testing. Landscaping companies evaluating a switch from low-voltage to solar can test solar on 8–10 projects before committing to 500-unit volume orders. That test-before-commit approach reduces adoption risk and lets contractors validate solar performance with their specific client base before making large inventory commitments.
Commercial-Grade Solar Specifications — What to Specify When Sourcing
Contractors switching from low-voltage to solar systems often ask what specifications separate commercial-grade fixtures from consumer-grade products. The performance gap isn't visible in product photos or marketing descriptions — it shows up in battery chemistry, solar panel wattage matching, IP rating test documentation, and component QC protocols.
Battery capacity and chemistry:
LiFePO4 (lithium iron phosphate) batteries are preferred over standard lithium-ion for landscape applications. LiFePO4 tolerates temperature extremes better (-4°F to 140°F operating range vs 32°F to 104°F for Li-ion), delivers 1,200–1,500 charge cycles vs 500–800 for Li-ion, and maintains more consistent voltage through discharge cycles (less brightness fade as battery drains through the night).
Specify battery capacity based on required runtime and LED wattage: 3.2V 3,000 mAh minimum for 80-lumen pathway fixtures (8–10 hour runtime), 4,000–5,000 mAh for 100–120 lumen fixtures. Undersized batteries are the most common cause of solar lighting failures — fixtures work correctly in summer when days are long and charging is robust, then fail to maintain full-night runtime in winter when charging is reduced. The battery needs enough capacity to handle worst-case charging conditions (short winter days, 3–4 consecutive cloudy days) and still deliver 6–8 hours of runtime.
Solar panel wattage matching:
Solar panel wattage must match battery capacity and daily charge requirements. A fixture that draws 1W during operation (typical for 80–100 lumen LED) and runs 8 hours per night consumes 8Wh of energy daily. The solar panel needs to replace that energy plus account for charge controller efficiency losses (15–20%) and winter sunlight reduction (50–60% of summer charging).
Effective solar panel sizing: 2–2.5W polycrystalline or monocrystalline panels for 80-lumen fixtures, 3–4W panels for 100–120 lumen fixtures. Monocrystalline panels cost $1–2 more per fixture but deliver 18–22% conversion efficiency vs 15–18% for polycrystalline. In northern climates or installations with limited direct sun exposure (under partial tree canopy, north-facing slopes), the efficiency difference justifies the panel upgrade.
Oversizing panel capacity by 30–50% relative to minimum charge requirements ensures winter charging adequacy. A fixture that technically needs 2W of panel capacity to replace nightly energy consumption should spec a 3W panel to handle seasonal sunlight variation and the gradual efficiency loss that solar panels experience over 5–10 years of UV exposure.
LED specifications:
Specify CRI (color rendering index) >70 for landscape applications where color accuracy matters — garden lighting, architectural accent lighting, pathway lighting near plantings. CRI measures how accurately colors appear under the light source compared to natural daylight. CRI 70–80 is adequate for functional lighting; CRI 80–90 is preferred for residential landscape aesthetics (makes plant colors and hardscape finishes look natural rather than washed-out or color-shifted).
Color temperature affects perceived brightness and aesthetic compatibility with architectural lighting:
- 3000K warm white: residential landscapes, hospitality properties, matches incandescent/halogen aesthetic
- 4000K neutral white: commercial properties, parking lots, pathway lighting where visibility matters more than ambiance
- 5000K–6000K daylight/cool white: security lighting, task lighting, industrial applications
LED binning consistency matters for batch purchases. LEDs are manufactured in bins based on color temperature and lumen output — a "3000K" LED might actually measure anywhere from 2850K to 3150K depending on which bin it came from. Commercial-grade fixtures use narrow-bin LEDs (±100K color temperature tolerance, ±5% lumen tolerance) to ensure consistent appearance across multiple fixtures. Consumer-grade fixtures use wide-bin LEDs (±300K color temperature tolerance, ±15% lumen tolerance), which causes visible color and brightness variation between fixtures purchased at different times.
IP rating requirements and testing:
IP65 rating minimum for raised pathway fixtures, wall lights, and installations above grade where water pooling doesn't occur. IP65 means dust-tight (first digit 6) and protected against water jets from any direction (second digit 5). Testing standard: fixture is sprayed with 12.5 liters per minute from a 6.3mm nozzle at 3 meters distance for 3 minutes from multiple angles, then inspected for water intrusion.
IP67 rating required for in-ground fixtures, installations in flood-prone areas, and any fixture exposed to direct irrigation spray. IP67 means dust-tight (first digit 6) and protected against temporary submersion up to 1 meter depth for 30 minutes (second digit 7). Testing standard: fixture is submerged in 1 meter of water for 30 minutes, then inspected for moisture intrusion and electrical function.
Request IP rating certification documentation when sourcing fixtures. Legitimate IP ratings are tested by third-party labs (Intertek, TÜV, SGS) and documented in test reports that specify the test standard used (IEC 60529), test date, and pass/fail results. Fixtures that claim IP ratings without test documentation are usually self-assessed by the manufacturer and may not survive field conditions. We maintain test reports for every fixture SKU and provide copies to contractors who request them — that documentation is part of what you're paying for in commercial-grade vs consumer-grade pricing.
Housing materials and UV stability:
Die-cast aluminum housings provide best durability and heat dissipation for LED drivers and batteries. Aluminum resists corrosion in landscape irrigation environments, dissipates heat that degrades battery and LED lifespan, and survives impacts from landscape maintenance equipment. Cost premium over plastic housings: $3–6 per fixture at volume.
ABS plastic housings with UV stabilization are acceptable for pathway and garden fixtures where heat buildup is minimal and impact risk is low. UV stabilization prevents plastic degradation and discoloration from sun exposure — untreated plastic housings become brittle and fade to chalky gray after 2–3 years of sun exposure. Specify UV-stabilized ABS or polycarbonate plastics rated for 5+ years outdoor exposure.
Avoid thin stamped steel housings common in consumer-grade solar lights. Stamped steel corrodes rapidly in landscape irrigation environments despite powder coating, and rust staining migrates onto hardscape and landscape beds. Steel housings also conduct heat into the battery compartment, reducing battery cycle life by 20–30% compared to aluminum or plastic housings with thermal isolation between the LED driver and battery.
Test and inspection documentation:
Commercial-grade fixtures should include batch-level QC documentation: lumen output test reports (integrating sphere measurements), battery charge/discharge cycle test results, IP rating certification, and LED binning specifications. That documentation proves the fixture matches published specifications rather than relying on manufacturer claims.
Request sample fixtures with full test documentation before placing volume orders. The sample cost ($45–65 per fixture including international shipping) is recoverable in the volume order if you proceed with purchase. Sample testing lets you validate:
- Actual lumen output matches specifications (measure with lux meter at standardized distance)
- Battery runtime matches rated capacity (full charge, then measure runtime until 50% brightness drop)
- Color temperature matches specification (visual comparison to reference fixtures, or measurement with color meter)
- Housing quality and finish match expectations (physical inspection, fit and finish assessment)
Factory site audits are available for high-volume contractors who want to verify production capabilities and QC processes before committing to annual purchase agreements. We host contractor visits quarterly and cover production line tour, testing lab inspection, component supplier verification, and batch QC protocol demonstration. Most contractors who visit our factory cite the testing lab and component verification process as key factors in their sourcing decision — seeing battery matching equipment, integrating sphere testing, and IP rating submersion tanks confirms that QC claims are backed by actual testing infrastructure.
When to Recommend Solar vs When to Recommend Low-Voltage — Contractor Decision Framework
Contractors who offer both systems need a decision framework that accounts for site conditions, project scale, client priorities, and margin targets. Solar landscape lighting vs low voltage isn't a universal answer — it's a site-specific and client-specific decision that optimizes for different constraints depending on the project.
Recommend solar when:
Project size exceeds 15 fixtures. The labor hour advantage of solar installations compounds at scale, and the transformer/wire infrastructure cost of low-voltage systems grows faster than linear with fixture count. A 20-fixture solar install takes 5 hours; a 20-fixture low-voltage install takes 15–18 hours. That 10–13 hour labor difference represents $400–520 in labor cost at $40/hour crew rates, which exceeds the solar fixture cost premium vs low-voltage fixtures.
Distance from power exceeds 100 feet. Voltage drop and wire cost make low-voltage uneconomical at distance. Wire runs over 150 feet require either 10-gauge wire ($0.60–0.90 per foot vs $0.35–0.50 for 12-gauge) or a second transformer closer to the fixture zone. Solar eliminates the distance-from-power constraint entirely — fixtures 300 feet from the nearest outlet cost the same to install as fixtures 30 feet away.
Rocky or sloped terrain increases trenching difficulty. Trenching through clay, rock, or root-filled soil raises low-voltage installation labor by 40–70% vs trenching through loam or sandy soil. Solar installations eliminate trenching entirely, so difficult soil conditions don't affect installation cost or timeline. Properties with significant slope also favor solar because wire routing on slopes requires deeper trenching or surface routing that's vulnerable to landscape maintenance damage.
Client prioritizes low maintenance. Solar battery replacement every 3–4 years is scheduled maintenance that clients can budget for; low-voltage wire damage and connection corrosion generate unpredictable callback requests. Clients who value predictable maintenance cost and low callback frequency (commercial property managers, HOA boards) often prefer solar systems once the battery replacement cycle is explained as planned maintenance rather than failure-driven service.
No outdoor outlets readily available. Adding outdoor outlets requires electrical permit, licensed electrician, and often 4–6 hours of labor per outlet ($400–800 per outlet installed). When the property has no convenient power access near the lighting zones, the cost to add outlets often exceeds the cost difference between solar and low-voltage fixtures. Running temporary power or extension cords for low-voltage transformer power is code-violation territory and creates liability risk.
Recommend low-voltage when:
Client has strong preference for grid-powered reliability regardless of cost. Some clients equate "solar" with "cheap" or "unreliable" based on past experience with consumer-grade products, and no amount of explanation about commercial-grade specifications will shift that perception. When grid power is readily available and the client is willing to pay for low-voltage installation, forcing solar into a proposal damages the relationship. Let the client's preference drive the system choice when cost isn't a constraint.
Project is <10 fixtures within 50 feet of power source. Small, concentrated installs minimize the infrastructure complexity that makes low-voltage expensive at scale. A 6-fixture pathway lighting project 30 feet from an outdoor outlet requires one transformer, one 50-foot wire run, and minimal trenching. The installed cost difference between solar and low-voltage on small projects is $120–200 total, and some clients are willing to pay that premium for the perceived reliability of grid power.
Historical property with visible wire routing constraints but accessible power. Properties where trenching is prohibited but surface wire routing through landscape beds is acceptable can accommodate low-voltage systems with minimal installation cost increase. Solar fixtures require staking or mounting, which may not be allowed in historical district landscapes or properties with preservation restrictions.
Projects where both work equally well:
10–15 fixture installs within 100 feet of power on level terrain with favorable soil conditions. This is the range where solar wins on margin (lower installation labor = higher profit per project) but low-voltage wins on client perception of reliability for clients who have concerns about solar performance. The commercial decision comes down to whether you prioritize margin or client preference. Most contractors we supply quote both options in this range and let the client choose based on installed cost difference — solar quote comes in $300–500 lower, and clients who want grid power pay the difference for low-voltage.
Hybrid installations:
Use low-voltage for high-visibility entry lighting, architectural accent lights, and building-mounted wall packs where clients prioritize maximum brightness and consistency. Use solar for pathway lighting, property perimeter security lights, and outlying garden zones where installation speed and cost matter more than absolute brightness consistency.
Hybrid layouts make sense on larger properties (1+ acre) where fixture zones are separated by 200+ feet. Running low-voltage wire across that distance is expensive and creates voltage drop problems; installing separate transformers for each zone multiplies infrastructure cost. Solar handles the distributed zones; low-voltage handles the concentrated building-adjacent zones. The cost optimization comes from matching each system to the site conditions where it performs best.
How to frame the recommendation to clients:
Lead with installed cost and 3-year total cost of ownership. Show the per-fixture installed cost breakdown (materials + labor) and the projected maintenance cost over 3 years. Clients who prioritize budget see the installed cost advantage immediately; clients who prioritize reliability see that maintenance cost is comparable between systems and focus on grid-powered consistency as the differentiator.
Use contractor experience as credibility signal. "We've installed 200+ solar lighting systems over the past 3 years, and callback rate is 2–3% annually — comparable to low-voltage systems. Most callbacks are warranty battery replacements in the first year, not recurring failure patterns." Contractors who only installed 8–10 solar projects can't credibly make that reliability claim, which is why we recommend contractors test solar on at least 15–20 projects before offering it as their primary system recommendation.
Offer to install one solar zone on trial before converting entire project. Risk-averse clients who haven't seen commercial-grade solar performance respond well to "install 6 solar pathway lights along the front walk this season, and if you're satisfied with performance we'll convert the rest of the property to solar next year." The trial approach builds confidence through direct experience rather than specification arguments, and successful trial zones typically convert to full property solar installs within 6–12 months.